Market Outlook
February 21, 2017
Market Cues
Domestic Indices
Chg (%)
(Pts)
(Close)
Indian markets are likely to open with a positive bias tracking SGX Nifty and Asian
BSE Sensex
0.7
193
28,662
markets.
Nifty
0.7
57
8,879
US markets were closed yesterday on the eve of President's day.
Mid Cap
0.7
92
13,514
European markets were mostly higher in early trade Monday, as higher commodity
Small Cap
0.9
122
13,590
prices and optimism about U.S. President Donald Trump's promised tax and
Bankex
0.3
81
23,523
regulation cuts helped outweigh French election worries.
Indian markets rose notably on Monday, with IT and telecom stocks pacing gainers,
Global Indices
Chg (%)
(Pts)
(Close)
as TCS' board approved a buyback of up to 5.6 crore equity shares and the latest
Dow Jones
0.0
4
20,624
buzz indicated the telecoms sector is on the brink of major consolidation.
Nasdaq
0.4
24
5,839
News Analysis
FTSE
(0.0)
(0)
7,300
TCS Buyback
Nikkei
0.1
16
19,251
Detailed analysis on Pg2
Hang Seng
0.5
112
24,146
Shanghai Com
1.2
38
3,240
Investor’s Ready Reckoner
Key Domestic & Global Indicators
Advances / Declines
BSE
NSE
Stock Watch: Latest investment recommendations on 150+ stocks
Advances
1,725
1,054
Refer Pg5 onwards
Declines
1,172
589
Top Picks
Unchanged
163
81
CMP
Target
Upside
Company
Sector
Rating
(`)
(`)
(%)
Amara Raja Batteries Auto & Auto Ancillary
Buy
863
1,009
16.9
Volumes (` Cr)
HCL Tech
IT
Buy
843
1,000
18.7
BSE
2,910
Power Grid Corp.
Power
Accumulate
206
223
8.3
NSE
19,596
Navkar Corp.
Others
Buy
165
265
60.9
KEI Industries
Others
Buy
178
207
16.6
Net Inflows (` Cr)
Net
Mtd
Ytd
More Top Picks on Pg3
FII
8,059
10,610
10,564
Key Upcoming Events
MFs
499
1,446
6,661
Previous
Consensus
Date
Region
Event Description
Reading
Expectations
Feb 21 Germany PMI Services
53.4
--
Top Gainers
Price (`)
Chg (%)
Feb 21 US
Existing Home sales
5.49
5.55
Marksans
49
20.0
Feb 22 Euro Zone Euro Zone CPI (yoY)
1.8
--
Dcbbank
153
10.6
Feb 22 Germany PMI Manufacturing
56.4
--
Punjlloyd
22
10.2
Feb 22 UK
GDP (YoY)
2.2
--
Deltacorp
128
7.9
More Events on Pg4
Jindalstel
100
7.8
Top Losers
Price (`)
Chg (%)
Aiaeng
1,462
(2.9)
Havells
415
(2.7)
Coromandel
333
(2.4)
Gruh
370
(1.8)
Ibrealest*
77
(1.8)
As on February 20, 2017
Market Outlook
February 21, 2017
News Analysis
TCS Buyback
Tata Consultancy Services (TCS), India’s biggest software services
provider, approved share buyback plan of up to `16,000cr. Promoters, of TCS
currently hold 73.33% in the company. TCS in a stock exchange filing said
that its board approved the buyback of up to 5.61cr shares, or 2.85% of its
share capital, at `2,850 each. The buyback is proposed to be made from the
shareholders of the company on a proportionate basis under the tender offer
route using the stock exchange mechanism, it added. The buyback is subject
to approval of the members by means of a special resolution through a postal
ballot, it said. The public announcement setting out the process, timelines and
other requisite details will be released in due course in accordance with the
Buyback Regulations.
The buyback of the shares, is a good indication of the under valuation of the
stock in the markets and also is good given that the cash yields are running
low and earning yield in IT industry has improved on back of the
underperformance of the stock. Also, the Buyback will take out a part of cash
out of the books, this will enhance the overall ROE’s as the proportion of the
low yielding asset ( i.e. cash ) will be reduced in the balance sheet and hence
will reward shareholders. We maintain our buy with the stock price of `2700,
though in near term the stock will exhibit significant strength around the price
of `2850.
Economic and Political News
Govt extends anti-dumping duty on steel pipes, tubes from China
Housing sales fall 31% in Dec quarter due to demonetization
I-T dept to launch phase 2 of 'Operation Clean Money' from March
India emerges 12th largest holder of US govt securities in 2016
Corporate News
Vedanta Group Q3 EBIDTA jumps 79%, revenue rises 26%
Nestle claims to have taken a `100cr hit on account of demonetization
Demonetisation lowers sales, raises textile inventories in Q3
Govt is considering Apple's proposal of Indian unit 'favourably'
Market Outlook
February 21, 2017
Top Picks ★★★★★
Large Cap
Market Cap
CMP
Target
Upside
Company
Rationale
(` Cr)
(`)
(`)
(%)
To outpace battery industry growth due to better
Amara Raja Batteries
14,747
863
1,009
16.9
technological products leading to market share gains in both
the automotive OEM and replacement segments.
The stock is trading at attractive valuations and is factoring
HCL Tech
1,18,893
843
1,000
18.7
all the bad news.
Back on the growth trend, expect a long term growth of 14%
Infosys
2,32,382
1,012
1,249
23.4
to be a US$20bn in FY2020.
Strong order backlog and improvement in execution would
Larsen & Toubro
1,38,233
1,482
1,634
10.3
trigger the growth for the L&T
One of the largest pharma companies with strong
Lupin
65,997
1,462
1,809
23.8
international presence. It has a rich pipeline of ANDAs which
is also one of the largest among the generic companies.
Going forward, we expect the company to report strong
Power Grid Corporation
1,07,771
206
223
8.3
top-line CAGR of ~16% and bottom-line CAGR of ~19%
over FY16-18 on back of strong capitalization guidance
Source: Company, Angel Research
Mid Cap
Market Cap
CMP
Target
Upside
Company
Rationale
(` Cr)
(`)
(`)
(%)
We expect the company would report strong profitability
Asian Granito
820
273
351
28.8
owing to better product mix, higher B2C sales and
amalgamation synergy.
Among the top 4 players in the consumer durables segment.
Bajaj Electricals
2,618
259
295
14.1
Improved profitability backed by turn around in E&P segment.
Strong order book lends earnings visibility.
Favourable outlook for the AC industry to augur well for
Cooling products business which is out pacing the market
Blue Star
5,319
557
634
13.9
growth. EMPPAC division's profitability to improve once
operating environment turns around.
With a focus on the low and medium income (LMI) consumer
Dewan Housing Finance
10,139
324
350
8.1
segment, the company has increased its presence in tier-II &
III cities where the growth opportunity is immense.
Strong loan growth backed by diversified loan portfolio and
Equitas Holdings
6,062
180
235
30.8
adequate CAR. ROE & ROA likely to remain decent as risk of
dilution remains low. Attractive valuations considering growth.
Economic recovery to have favourable impact on advertising
& circulation revenue growth. Further, the acquisition of a
Jagran Prakashan
6,221
190
225
18.2
radio business (Radio City) would also boost the company's
revenue growth.
High order book execution in EPC segment, rising B2C sales
KEI Industries
1,382
178
207
16.6
and higher exports to boost the revenues and profitability
Speedier execution and speedier sales, strong revenue visibilty
Mahindra Lifespace
1,435
350
522
49.2
in short-to-long run, attractive valuations
Higher growth in domestic branded sales and healthy export
Mirza International
1,126
94
107
14.3
to boost the profitability.
Massive capacity expansion along with rail advantage at ICD
Navkar Corporation
2,349
165
265
60.9
as well CFS augurs well for the company
Market leadership in Hindi news genre and no. 2 viewership
ranking in English news genre, exit from the radio business,
TV Today Network
1,583
265
385
45.1
and anticipated growth in ad spends by corporates to benefit
the stock.
Source: Company, Angel Research
Market Outlook
February 21, 2017
Key Upcoming Events
Result Calendar
Date
Company
February 21, 2017
ITD Cementation
Source: Bloomberg, Angel Research
Global economic events release calendar
Bloomberg Data
Date
Time
Country
Event Description
Unit
Period
Last Reported
Estimated
Feb 20, 2017
7:00 PM US
Building permits
Thousands
Jan
1228.00
1230.00
Feb 21, 2017
2:00 PM Germany PMI Services
Value
Feb P
53.40
8:30 PM US
Existing home sales
Million
Jan
5.49
5.55
Feb 22, 2017
2:00 PM Germany PMI Manufacturing
Value
Feb P
56.40
3:30 PM Euro Zone Euro-Zone CPI (YoY)
%
Jan F
1.80
3:00 PM UK
GDP (YoY)
% Change
4Q P
2.20
Feb 23, 2017
12:30 PM Germany GDP nsa (YoY)
% Change
4Q F
1.20
Feb 24, 2017
8:30 PM US
New home sales
Thousands
Jan
536.00
572.50
Feb 28, 2017
8:30 PM US
Consumer Confidence
S.A./ 1985=100
Feb
111.80
111.00
7:00 PM US
GDP Qoq (Annualised)
% Change
4Q S
1.90
2.00
Mar 01, 2017
2:25 PM Germany Unemployment change (000's)
Thousands
Feb
-26.00
3:00 PM UK
PMI Manufacturing
Value
Feb
55.90
6:30 AM China
PMI Manufacturing
Value
Feb
51.30
Mar 07, 2017
3:30 PM Euro Zone Euro-Zone GDP s.a. (QoQ)
% Change
4Q F
0.40
March 08, 2017 7:00 AM China
Consumer Price Index (YoY)
% Change
Feb
2.50
Mar 09, 2017
China
Exports YoY%
% Change
Feb
7.90
6:15 PM Euro Zone ECB announces interest rates
%
Mar 9
0.00
Mar 10, 2017
India
Imports YoY%
% Change
Feb
10.70
India
Exports YoY%
% Change
Feb
4.30
Source: Bloomberg, Angel Research
Market Outlook
February 21, 2017
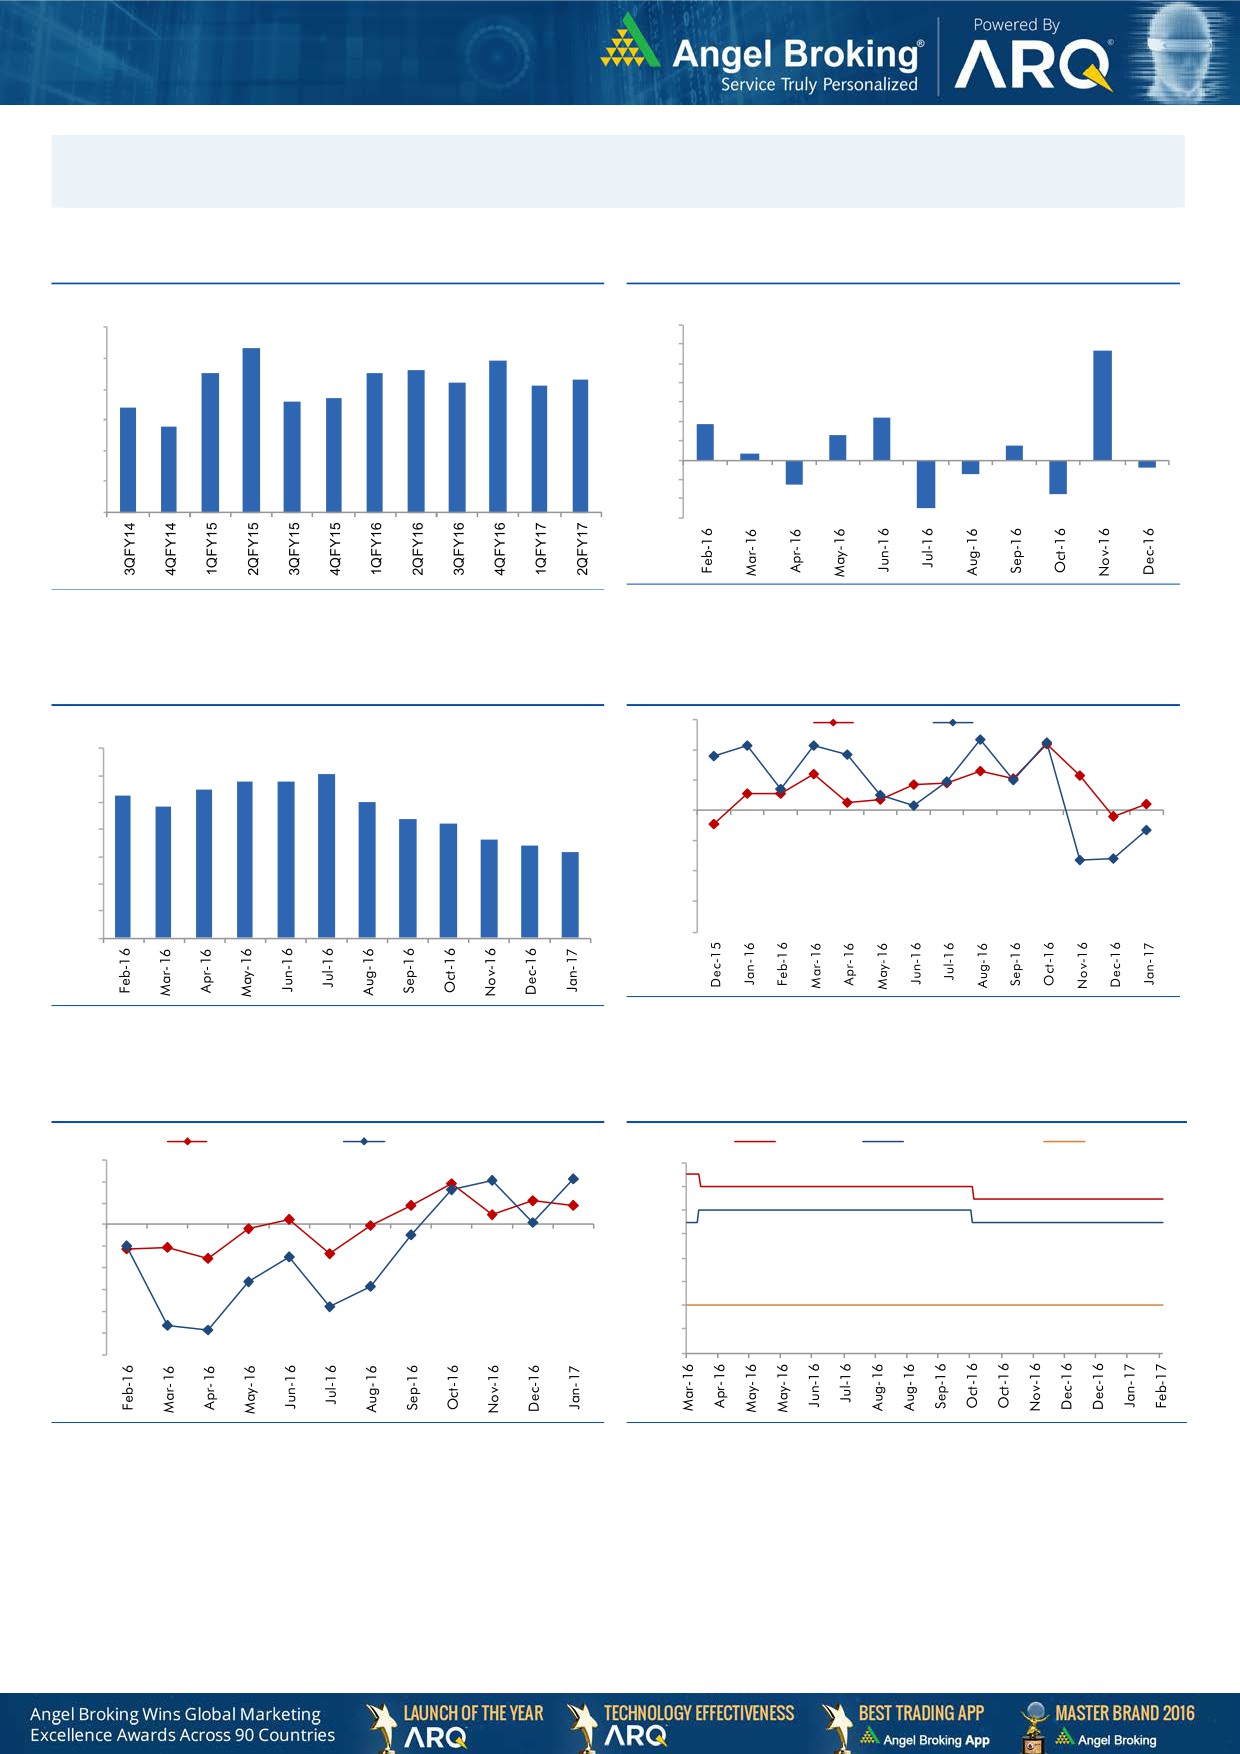
Macro watch
Exhibit 1: Quarterly GDP trends
Exhibit 2: IIP trends
(%)
(%)
9.0
7.0
8.3
5.7
7.9
6.0
8.0
7.5
7.5
7.6
7.3
5.0
7.2
7.1
6.6
6.7
4.0
7.0
6.4
3.0
2.2
5.8
1.9
6.0
2.0
1.3
0.7
1.0
0.3
5.0
-
4.0
(1.0)
(0.7)
(0.4)
(2.0)
(1.3)
3.0
(1.8)
(3.0)
(2.5)
Source: MOSPI, Angel Research
Source: CSO, Angel Research
Exhibit 3: Monthly CPI inflation trends
Exhibit 4: Manufacturing and services PMI
56.0
Mfg. PMI
Services PMI
(%)
7.0
54.0
6.1
5.8
5.8
6.0
5.5
5.3
5.1
52.0
4.8
5.0
4.4
4.2
50.0
3.6
4.0
3.4
3.2
48.0
3.0
46.0
2.0
44.0
1.0
42.0
-
Source: Market, Angel Research; Note: Level above 50 indicates expansion
Source: MOSPI, Angel Research
Exhibit 5: Exports and imports growth trends
Exhibit 6: Key policy rates
(%)
Exports yoy growth
Imports yoy growth
(%)
Repo rate
Reverse Repo rate
CRR
15.0
7.00
10.0
6.50
5 .0
6.00
0 .0
5.50
(5.0)
5.00
(10.0)
4.50
(15.0)
4.00
(20.0)
(25.0)
3.50
(30.0)
3.00
Source: Bloomberg, Angel Research
Source: RBI, Angel Research
Market Outlook
February 21, 2017
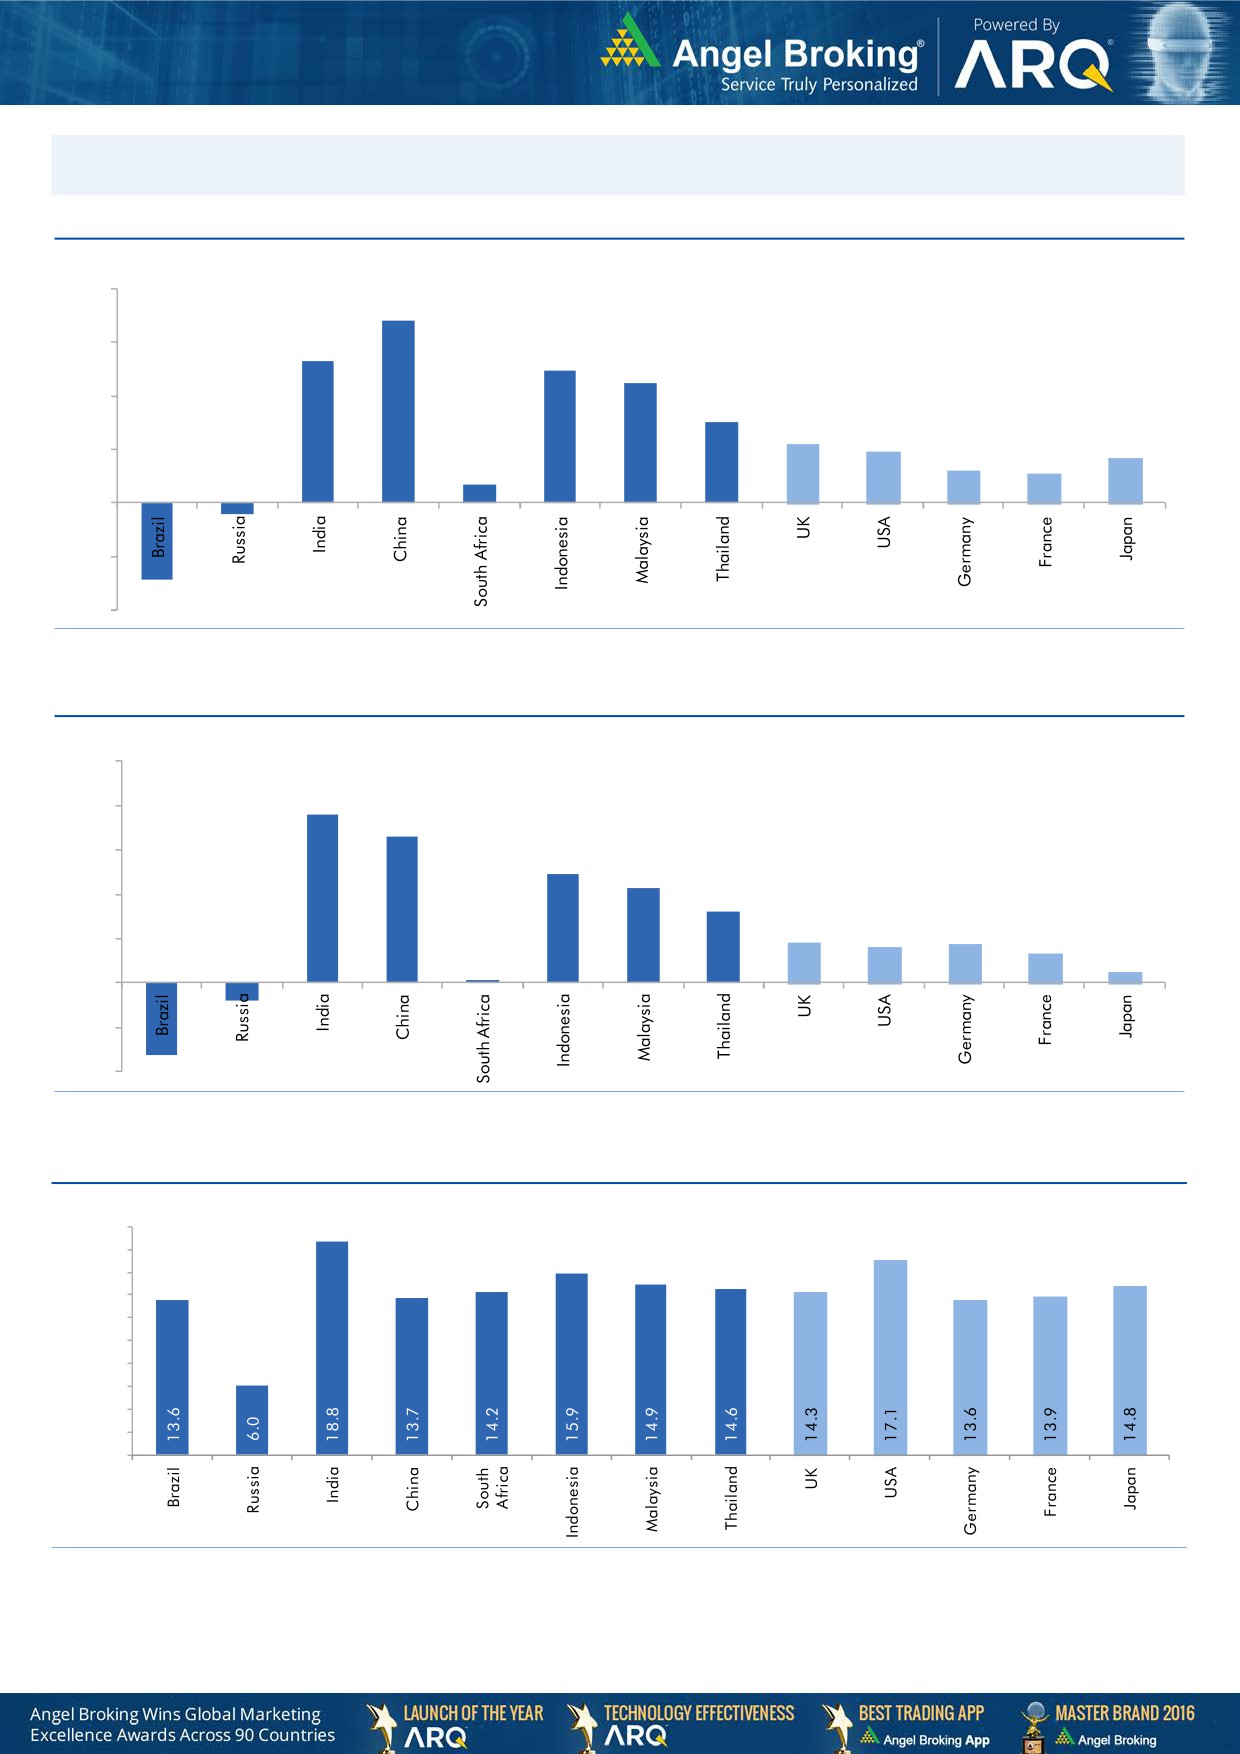
Global watch
Exhibit 1: Latest quarterly GDP Growth (%, yoy) across select developing and developed countries
(%)
8.0
6.8
5.3
6.0
4.9
0.7
4.5
4.0
3.0
2.2
1.9
1.7
2.0
1.2
1.1
-
(2.0)
(0.4)
(2.9)
(4.0)
Source: Bloomberg, Angel Research
Exhibit 2: 2016 GDP Growth projection by IMF (%, yoy) across select developing and developed countries
(%)
10.0
7.6
8.0
6.6
6.0
4.9
4.3
4.0
3.2
1.8
1.6
1.7
2.0
1.3
(0.8)
0.5
(3.3)
0.1
-
(2.0)
(4.0)
Source: IMF, Angel Research
Exhibit 3: One year forward P-E ratio across select developing and developed countries
(x)
20.0
18.0
16.0
14.0
12.0
10.0
8.0
6.0
4.0
2.0
-
Source: IMF, Angel Research
Market Outlook
February 21, 2017
Exhibit 4: Relative performance of indices across globe
Returns (%)
Country
Name of index
Closing price
1M
3M
1YR
Brazil
Bovespa
68,533
6.8
14.3
58.5
Russia
Micex
2,119
(2.0)
2.9
17.9
India
Nifty
8,879
5.5
12.0
24.0
China
Shanghai Composite
3,240
4.3
1.2
16.7
South Africa
Top 40
45,506
(1.3)
4.4
2.1
Mexico
Mexbol
47,084
1.6
4.8
8.9
Indonesia
LQ45
888
0.3
2.1
7.0
Malaysia
KLCI
1,713
3.2
5.9
3.8
Thailand
SET 50
990
1.8
7.6
19.9
USA
Dow Jones
20,624
4.1
9.0
24.1
UK
FTSE
7,300
1.3
7.4
22.4
Japan
Nikkei
19,251
0.9
9.0
22.5
Germany
DAX
11,828
2.0
10.7
24.3
France
CAC
4,865
0.5
7.4
10.4
Source: Bloomberg, Angel Research
Stock Watch
February 21, 2017
Company Name
Reco
CMP
Target
Mkt Cap
Sales ( Čcr )
OPM(%)
EPS (Č)
PER(x)
P/BV(x)
RoE(%)
EV/Sales(x)
(Č)
Price ( Č)
( Č cr )
FY17E FY18E
FY17E
FY18E
FY17E
FY18E
FY17E
FY18E
FY17E
FY18E
FY17E
FY18E
FY17E
FY18E
Agri / Agri Chemical
Rallis
Neutral
246
-
4,792
1,937
2,164
13.3
14.3
9.0
11.0
27.4
22.4
4.8
4.2
18.4
19.8
2.5
2.2
United Phosphorus
Neutral
715
-
36,252
15,176
17,604
18.5
18.5
37.4
44.6
19.1
16.0
3.8
3.1
21.4
21.2
2.5
2.1
Auto & Auto Ancillary
Ashok Leyland
Buy
94
111
26,865
20,021
21,915
11.6
11.9
4.5
5.3
21.0
17.7
4.3
3.8
20.6
21.5
1.3
1.1
Bajaj Auto
Neutral
2,785
-
80,574
25,093
27,891
19.5
19.2
143.9
162.5
19.4
17.1
5.4
4.7
30.3
29.4
2.9
2.6
Bharat Forge
Neutral
1,077
-
25,078
7,726
8,713
20.5
21.2
35.3
42.7
30.5
25.2
5.6
5.1
18.9
20.1
3.3
2.9
Eicher Motors
Neutral
25,139
-
68,404
16,583
20,447
17.5
18.0
598.0
745.2
42.0
33.7
14.4
10.9
41.2
38.3
4.0
3.1
Gabriel India
Accumulate
115
130
1,648
1,544
1,715
9.0
9.3
5.4
6.3
21.2
18.2
4.0
3.6
18.9
19.5
1.0
0.9
Hero Motocorp
Accumulate
3,103
3,446
61,966
28,083
30,096
15.3
15.7
171.8
187.0
18.1
16.6
6.3
5.3
30.1
27.9
2.0
1.8
Jamna Auto Industries Neutral
202
-
1,605
1,486
1,620
9.8
9.9
15.0
17.2
13.4
11.7
2.9
2.5
21.8
21.3
1.1
1.0
L G Balakrishnan & Bros Neutral
572
-
898
1,302
1,432
11.6
11.9
43.7
53.0
13.1
10.8
1.9
1.7
13.8
14.2
0.8
0.7
Mahindra and Mahindra Neutral
1,321
-
82,037
46,534
53,077
11.6
11.7
67.3
78.1
19.6
16.9
3.2
2.8
15.4
15.8
1.7
1.5
Maruti
Accumulate
6,092
6,560
184,024
67,822
83,288
16.0
16.4
253.8
312.4
24.0
19.5
5.5
4.5
23.0
22.9
2.4
1.9
Minda Industries
Neutral
381
-
3,024
2,728
3,042
9.0
9.1
68.2
86.2
5.6
4.4
1.3
1.0
23.8
24.3
1.2
1.0
Motherson Sumi
Neutral
351
-
49,203
45,896
53,687
7.8
8.3
13.0
16.1
26.9
21.8
8.7
6.9
34.7
35.4
1.1
1.0
Rane Brake Lining
Neutral
972
-
769
511
562
11.3
11.5
28.1
30.9
34.6
31.4
5.3
4.8
15.3
15.0
1.6
1.5
Setco Automotive
Neutral
35
-
472
741
837
13.0
13.0
15.2
17.0
2.3
2.1
0.4
0.4
15.8
16.3
1.0
0.9
Tata Motors
Neutral
456
-
131,519
300,209
338,549
8.9
8.4
42.7
54.3
10.7
8.4
1.7
1.4
15.6
17.2
0.6
0.5
TVS Motor
Neutral
426
-
20,224
13,390
15,948
6.9
7.1
12.8
16.5
33.4
25.7
8.3
6.6
26.3
27.2
1.6
1.3
Amara Raja Batteries
Buy
863
1,009
14,747
5,305
6,100
16.0
16.3
28.4
34.0
30.4
25.4
5.9
4.9
19.3
19.3
2.8
2.4
Exide Industries
Neutral
215
-
18,288
7,439
8,307
15.0
15.0
8.1
9.3
26.6
23.1
3.7
3.3
14.3
16.7
2.1
1.9
Apollo Tyres
Buy
180
235
9,142
12,877
14,504
14.3
13.9
21.4
23.0
8.4
7.8
1.3
1.1
16.4
15.2
0.9
0.8
Ceat
Buy
1,122
1,450
4,540
7,524
8,624
13.0
12.7
131.1
144.3
8.6
7.8
1.6
1.3
19.8
18.6
0.7
0.6
JK Tyres
Neutral
119
-
2,698
7,455
8,056
15.0
15.0
21.8
24.5
5.5
4.9
1.1
0.9
22.8
21.3
0.5
0.4
Swaraj Engines
Neutral
1,385
-
1,720
660
810
15.2
16.4
54.5
72.8
25.4
19.0
7.9
7.2
31.5
39.2
2.4
2.0
Subros
Neutral
203
-
1,218
1,488
1,681
11.7
11.9
6.4
7.2
31.7
28.3
3.4
3.0
10.8
11.4
1.1
0.9
Indag Rubber
Neutral
180
-
472
286
326
19.8
16.8
11.7
13.3
15.4
13.5
2.6
2.4
17.8
17.1
1.3
1.2
Capital Goods
ACE
Neutral
53
-
523
709
814
4.1
4.6
1.4
2.1
37.8
25.2
1.6
1.5
4.4
6.0
0.9
0.8
BEML
Neutral
1,315
-
5,476
3,451
4,055
6.3
9.2
31.4
57.9
41.9
22.7
2.5
2.3
6.3
10.9
1.7
1.4
Bharat Electronics
Neutral
1,536
-
34,305
8,137
9,169
16.8
17.2
58.7
62.5
26.2
24.6
4.1
3.6
44.6
46.3
3.2
2.9
Stock Watch
February 21, 2017
Company Name
Reco
CMP
Target
Mkt Cap
Sales ( Čcr )
OPM(%)
EPS (Č)
PER(x)
P/BV(x)
RoE(%)
EV/Sales(x)
(Č)
Price ( Č)
( Č cr )
FY17E
FY18E
FY17E
FY18E
FY17E
FY18E
FY17E
FY18E
FY17E
FY18E
FY17E
FY18E
FY17E
FY18E
Capital Goods
Voltas
Buy
349
407
11,536
6,511
7,514
7.9
8.7
12.9
16.3
27.0
21.4
4.9
4.3
16.7
18.5
1.5
1.3
BGR Energy
Neutral
140
-
1,010
16,567
33,848
6.0
5.6
7.8
5.9
17.9
23.7
1.0
1.0
4.7
4.2
0.2
0.1
BHEL
Neutral
153
-
37,534
28,797
34,742
-
2.8
2.3
6.9
66.7
22.2
1.1
1.1
1.3
4.8
1.0
0.7
Blue Star
Accumulate
557
634
5,319
4,283
5,077
5.9
7.3
14.9
22.1
37.4
25.2
7.3
6.1
20.4
26.4
1.3
1.1
Crompton Greaves
Neutral
68
-
4,252
5,777
6,120
5.9
7.0
3.3
4.5
20.6
15.1
0.9
0.9
4.4
5.9
0.7
0.6
Greaves Cotton
Neutral
164
-
4,001
1,755
1,881
16.8
16.9
7.8
8.5
21.0
19.3
4.2
3.9
20.6
20.9
2.0
1.8
Inox Wind
Neutral
172
-
3,816
5,605
6,267
15.7
16.4
24.8
30.0
6.9
5.7
1.9
1.4
25.9
24.4
0.7
0.6
KEC International
Neutral
168
-
4,309
9,294
10,186
7.9
8.1
9.9
11.9
16.9
14.1
2.5
2.2
15.6
16.3
0.7
0.6
KEI Industries
Buy
178
207
1,382
2,682
3,058
10.4
10.0
11.7
12.8
15.1
13.9
3.0
2.5
20.1
18.2
0.7
0.6
Thermax
Neutral
850
-
10,127
5,421
5,940
7.3
7.3
25.7
30.2
33.1
28.1
4.0
3.7
12.2
13.1
1.8
1.6
VATech Wabag
Buy
522
681
2,850
3,136
3,845
8.9
9.1
26.0
35.9
20.1
14.6
2.5
2.1
13.4
15.9
0.8
0.6
Cement
ACC
Neutral
1,455
-
27,323
11,225
13,172
13.2
16.9
44.5
75.5
32.7
19.3
3.1
2.9
11.2
14.2
2.4
2.1
Ambuja Cements
Neutral
239
-
47,536
9,350
10,979
18.2
22.5
5.8
9.5
41.3
25.2
3.5
3.1
10.2
12.5
5.1
4.3
India Cements
Neutral
163
-
4,992
4,364
4,997
18.5
19.2
7.9
11.3
20.6
14.4
1.5
1.4
8.0
8.5
1.9
1.7
JK Cement
Neutral
899
-
6,286
4,398
5,173
15.5
17.5
31.2
55.5
28.8
16.2
3.5
3.0
12.0
15.5
2.0
1.6
J K Lakshmi Cement
Neutral
387
-
4,554
2,913
3,412
14.5
19.5
7.5
22.5
51.6
17.2
3.2
2.7
12.5
18.0
2.2
1.8
Orient Cement
Neutral
133
-
2,725
2,114
2,558
18.5
20.5
8.1
11.3
16.4
11.8
2.4
2.1
9.0
14.0
1.9
1.5
UltraTech Cement
Neutral
3,740
-
102,657
25,768
30,385
21.0
23.5
111.0
160.0
33.7
23.4
4.3
3.8
13.5
15.8
4.1
3.4
Construction
ITNL
Neutral
105
-
3,454
8,946
10,017
31.0
31.6
8.1
9.1
13.0
11.5
0.5
0.5
4.2
5.0
3.7
3.4
KNR Constructions
Neutral
180
-
2,531
1,385
1,673
14.7
14.0
41.2
48.5
4.4
3.7
0.8
0.7
14.9
15.2
1.9
1.6
Larsen & Toubro
Accumulate
1,482
1,634
138,233
111,017
124,908
11.0
11.0
61.1
66.7
24.3
22.2
2.9
2.7
13.1
12.9
2.3
2.1
Gujarat Pipavav Port
Neutral
166
-
8,020
705
788
52.2
51.7
5.0
5.6
33.2
29.6
3.3
2.9
11.2
11.2
11.0
9.4
Nagarjuna Const.
Neutral
84
-
4,659
8,842
9,775
9.1
8.8
5.3
6.4
15.8
13.1
1.3
1.2
8.2
9.1
0.7
0.6
PNC Infratech
Buy
105
143
2,691
2,350
2,904
13.1
13.2
9.0
8.8
11.7
11.9
0.4
0.4
15.9
13.9
1.3
1.0
Simplex Infra
Neutral
309
-
1,529
6,829
7,954
10.5
10.5
31.4
37.4
9.8
8.3
1.0
0.9
9.9
13.4
0.7
0.5
Power Mech Projects
Neutral
444
-
653
1,801
2,219
12.7
14.6
72.1
113.9
6.2
3.9
1.1
1.0
16.8
11.9
0.4
0.3
Sadbhav Engineering
Accumulate
277
298
4,760
3,598
4,140
10.3
10.6
9.0
11.9
30.8
23.3
3.2
2.8
9.9
11.9
1.6
1.4
NBCC
Neutral
177
-
15,935
7,428
9,549
7.9
8.6
8.2
11.0
21.6
16.1
1.1
0.9
28.2
28.7
1.9
1.4
MEP Infra
Neutral
43
-
701
1,877
1,943
30.6
29.8
3.0
4.2
14.4
10.3
7.0
4.7
0.6
0.6
1.8
1.6
Stock Watch
February 21, 2017
Company Name
Reco
CMP
Target
Mkt Cap
Sales ( Čcr )
OPM(%)
EPS (Č)
PER(x)
P/BV(x)
RoE(%)
EV/Sales(x)
(Č)
Price ( Č)
( Č cr )
FY17E
FY18E
FY17E
FY18E
FY17E
FY18E
FY17E
FY18E
FY17E
FY18E
FY17E
FY18E
FY17E
FY18E
Construction
SIPL
Neutral
94
-
3,311
1,036
1,252
65.5
66.2
(8.4)
(5.6)
3.5
4.0
(22.8)
(15.9)
11.4
9.5
Engineers India
Neutral
152
-
10,253
1,725
1,935
16.0
19.1
11.4
13.9
13.4
11.0
1.8
1.8
13.4
15.3
4.9
4.4
Financials
Axis Bank
Buy
481
580
114,949
46,932
53,575
3.5
3.4
32.4
44.6
14.9
10.8
1.9
1.7
13.6
16.5
-
-
Bank of Baroda
Neutral
169
-
38,883
19,980
23,178
1.8
1.8
11.5
17.3
14.7
9.8
1.7
1.4
8.3
10.1
-
-
Canara Bank
Neutral
290
-
15,755
15,225
16,836
1.8
1.8
14.5
28.0
20.0
10.4
1.4
1.1
5.8
8.5
-
-
Can Fin Homes
Accumulate
1,977
2,128
5,263
420
526
3.5
3.5
86.5
107.8
22.9
18.3
4.9
4.0
23.6
24.1
-
-
Cholamandalam Inv. &
Buy
1,021
1,230
15,958
2,012
2,317
6.3
6.3
42.7
53.6
23.9
19.1
3.8
3.2
16.9
18.3
-
-
Fin. Co.
Dewan Housing Finance Accumulate
324
350
10,139
2,225
2,688
2.9
2.9
29.7
34.6
10.9
9.4
1.8
1.5
16.1
16.8
-
-
Equitas Holdings
Buy
180
235
6,062
939
1,281
11.7
11.5
5.8
8.2
31.0
21.9
2.7
2.4
10.9
11.5
-
-
Federal Bank
Neutral
86
-
14,813
8,259
8,995
3.0
3.0
4.3
5.6
20.0
15.4
1.7
1.6
8.5
10.1
-
-
HDFC
Neutral
1,394
-
221,118
11,475
13,450
3.4
3.4
45.3
52.5
30.8
26.6
5.9
5.2
20.2
20.5
-
-
HDFC Bank
Neutral
1,407
-
360,002
46,097
55,433
4.5
4.5
58.4
68.0
24.1
20.7
4.2
3.5
18.8
18.6
-
-
ICICI Bank
Accumulate
282
315
164,292
42,800
44,686
3.1
3.3
18.0
21.9
15.7
12.9
2.1
2.0
11.1
12.3
-
-
Lakshmi Vilas Bank
Accumulate
153
174
2,924
3,339
3,799
2.7
2.8
11.0
14.0
13.9
10.9
1.4
1.3
11.2
12.7
-
-
LIC Housing Finance
Accumulate
559
630
28,218
3,712
4,293
2.6
2.5
39.0
46.0
14.3
12.2
2.7
2.3
19.9
20.1
-
-
Punjab Natl.Bank
Neutral
143
-
30,377
23,532
23,595
2.3
2.4
6.8
12.6
21.0
11.3
3.2
2.3
3.3
6.5
-
-
RBL Bank
Neutral
425
-
15,726
1,783
2,309
2.6
2.6
12.7
16.4
33.5
25.9
3.7
3.3
12.8
13.3
-
-
South Ind.Bank
Neutral
21
-
2,799
6,435
7,578
2.5
2.5
2.7
3.1
7.7
6.7
1.0
0.8
10.1
11.2
-
-
St Bk of India
Neutral
269
-
214,687
88,650
98,335
2.6
2.6
13.5
18.8
19.9
14.3
1.9
1.7
7.0
8.5
-
-
Union Bank
Neutral
142
-
9,731
13,450
14,925
2.3
2.3
25.5
34.5
5.6
4.1
0.8
0.7
7.5
10.2
-
-
Yes Bank
Neutral
1,429
-
60,485
8,978
11,281
3.3
3.4
74.0
90.0
19.3
15.9
3.7
3.1
17.0
17.2
-
-
FMCG
Asian Paints
Neutral
974
-
93,445
17,128
18,978
16.8
16.4
19.1
20.7
51.0
47.1
17.7
16.7
34.8
35.5
5.4
4.9
Britannia
Accumulate
3,264
3,626
39,163
9,594
11,011
14.6
14.9
80.3
94.0
40.6
34.7
16.7
12.9
41.2
-
3.9
3.4
Colgate
Accumulate
921
995
25,042
4,605
5,149
23.4
23.4
23.8
26.9
38.7
34.2
21.4
16.7
64.8
66.8
5.4
4.8
Dabur India
Accumulate
265
304
46,654
8,315
9,405
19.8
20.7
8.1
9.2
32.7
28.8
9.1
7.6
31.6
31.0
5.3
4.6
GlaxoSmith Con*
Neutral
5,135
-
21,596
4,350
4,823
21.2
21.4
179.2
196.5
28.7
26.1
7.6
6.4
27.1
26.8
4.3
3.8
Godrej Consumer
Neutral
1,642
-
55,927
10,235
11,428
18.4
18.6
41.1
44.2
40.0
37.2
8.9
7.5
24.9
24.8
5.5
4.9
HUL
Neutral
853
-
184,569
35,252
38,495
17.8
17.8
20.7
22.4
41.3
38.1
39.5
33.9
95.6
88.9
5.1
4.6
ITC
Accumulate
266
284
322,373
40,059
44,439
38.3
39.2
9.0
10.1
29.6
26.2
8.3
7.2
27.8
27.5
7.6
6.8
Stock Watch
February 21, 2017
Company Name
Reco
CMP
Target
Mkt Cap
Sales ( Čcr )
OPM(%)
EPS (Č)
PER(x)
P/BV(x)
RoE(%)
EV/Sales(x)
(Č)
Price ( Č)
( Č cr )
FY17E FY18E
FY17E
FY18E
FY17E
FY18E
FY17E
FY18E
FY17E
FY18E
FY17E
FY18E
FY17E
FY18E
FMCG
Marico
Accumulate
267
300
34,446
6,430
7,349
18.8
19.5
6.4
7.7
41.7
34.7
12.6
10.6
33.2
32.5
5.2
4.5
Nestle*
Neutral
6,235
-
60,115
10,073
11,807
20.7
21.5
124.8
154.2
50.0
40.4
20.5
18.5
34.8
36.7
5.8
4.9
Tata Global
Neutral
142
-
8,937
8,675
9,088
9.8
9.8
7.4
8.2
19.1
17.3
2.2
2.1
7.9
8.1
0.9
0.9
Procter & Gamble
Accumulate
6,945
7,369
22,544
2,939
3,342
23.2
23.0
146.2
163.7
47.5
42.4
106.4
102.0
25.3
23.5
7.2
6.3
Hygiene
IT
HCL Tech^
Buy
843
1,000
118,893
49,242
57,168
20.5
20.5
55.7
64.1
15.1
13.1
3.1
2.4
20.3
17.9
2.3
1.8
Infosys
Buy
1,012
1,249
232,382
68,350
77,326
27.0
27.0
62.5
69.4
16.2
14.6
3.5
3.2
21.3
21.6
2.8
2.5
TCS
Neutral
2,507
-
493,888
119,025
133,308
27.6
27.6
131.2
145.5
19.1
17.2
6.2
5.7
32.4
33.1
3.9
3.5
Tech Mahindra
Buy
500
600
48,630
29,673
32,937
15.5
17.0
32.8
39.9
15.2
12.5
3.0
2.6
19.6
20.7
1.4
1.2
Wipro
Buy
478
583
116,184
55,440
60,430
18.1
18.1
36.1
38.9
13.2
12.3
2.4
2.2
19.0
17.6
1.8
1.6
Media
D B Corp
Neutral
380
-
6,987
2,297
2,590
27.4
28.2
21.0
23.4
18.1
16.2
4.2
3.7
23.7
23.1
2.8
2.4
HT Media
Neutral
87
-
2,021
2,693
2,991
12.6
12.9
7.9
9.0
11.0
9.7
0.9
0.9
7.8
8.3
0.3
0.2
Jagran Prakashan
Buy
190
225
6,221
2,355
2,635
28.0
28.0
10.8
12.5
17.6
15.2
3.8
3.3
21.7
21.7
2.7
2.3
Sun TV Network
Neutral
700
-
27,586
2,850
3,265
70.1
71.0
26.2
30.4
26.7
23.0
6.8
6.0
24.3
25.6
9.3
8.0
Hindustan Media
Neutral
268
-
1,967
1,016
1,138
24.3
25.2
27.3
30.1
9.8
8.9
1.9
1.7
16.2
15.8
1.3
1.1
Ventures
TV Today Network
Buy
265
385
1,583
637
743
27.5
27.5
18.4
21.4
14.4
12.4
2.5
2.1
17.4
17.2
2.1
1.7
Metals & Mining
Coal India
Neutral
320
-
198,668
84,638
94,297
21.4
22.3
24.5
27.1
13.1
11.8
5.4
5.2
42.6
46.0
1.9
1.7
Hind. Zinc
Neutral
303
-
127,858
14,252
18,465
55.9
48.3
15.8
21.5
19.2
14.1
3.1
2.7
17.0
20.7
9.0
6.9
Hindalco
Neutral
183
-
37,846
107,899
112,095
7.4
8.2
9.2
13.0
19.9
14.1
1.0
0.9
4.8
6.6
0.9
0.8
JSW Steel
Neutral
188
-
45,480
53,201
58,779
16.1
16.2
130.6
153.7
1.4
1.2
0.2
0.2
14.0
14.4
1.6
1.4
NMDC
Neutral
140
-
44,215
6,643
7,284
44.4
47.7
7.1
7.7
19.7
18.2
1.7
1.7
8.8
9.2
4.4
4.0
SAIL
Neutral
62
-
25,483
47,528
53,738
(0.7)
2.1
(1.9)
2.6
23.7
0.7
0.6
(1.6)
3.9
1.4
1.3
Vedanta
Neutral
270
-
80,165
71,744
81,944
19.2
21.7
13.4
20.1
20.2
13.5
1.7
1.6
8.4
11.3
1.5
1.2
Tata Steel
Neutral
487
-
47,269
121,374
121,856
7.2
8.4
18.6
34.3
26.2
14.2
1.6
1.5
6.1
10.1
1.0
1.0
Oil & Gas
Cairn India
Neutral
294
-
55,236
9,127
10,632
4.3
20.6
8.8
11.7
33.5
25.2
1.1
1.0
3.3
4.2
7.5
6.3
GAIL
Neutral
524
-
66,468
56,220
65,198
9.3
10.1
27.1
33.3
19.3
15.7
1.8
1.7
9.3
10.7
1.4
1.2
ONGC
Neutral
195
-
249,863
137,222
152,563
15.0
21.8
19.5
24.1
10.0
8.1
0.9
0.8
8.5
10.1
2.1
1.9
Indian Oil Corp
Neutral
386
-
187,219
373,359
428,656
5.9
5.5
54.0
59.3
7.1
6.5
1.1
1.0
16.0
15.6
0.7
0.6
Reliance Industries
Neutral
1,074
-
348,293
301,963
358,039
12.1
12.6
87.7
101.7
12.2
10.6
1.3
1.1
10.7
11.3
1.6
1.4
Pharmaceuticals
Alembic Pharma
Neutral
579
-
10,906
3,483
4,083
20.2
21.4
24.3
30.4
23.8
19.0
5.4
4.3
25.5
25.3
3.1
2.5
Stock Watch
February 21, 2017
Company Name
Reco
CMP
Target
Mkt Cap
Sales ( Čcr )
OPM(%)
EPS (Č)
PER(x)
P/BV(x)
RoE(%)
EV/Sales(x)
(Č)
Price ( Č)
( Č cr )
FY17E
FY18E
FY17E
FY18E
FY17E
FY18E
FY17E
FY18E
FY17E
FY18E
FY17E
FY18E
FY17E
FY18E
Pharmaceuticals
Alkem Laboratories Ltd
Neutral
2,035
-
24,336
6,050
6,839
18.7
19.8
80.0
88.7
25.4
23.0
5.7
4.8
22.4
20.9
4.0
3.5
Aurobindo Pharma
Buy
670
877
39,180
15,720
18,078
23.7
23.7
41.4
47.3
16.2
14.2
4.2
3.3
29.6
26.1
2.7
2.4
Aventis*
Neutral
4,170
-
9,604
2,277
2,597
17.3
18.3
149.4
172.0
27.9
24.2
4.6
3.7
25.1
28.8
3.9
3.2
Cadila Healthcare
Neutral
444
-
45,500
10,429
12,318
22.6
22.0
16.9
19.2
26.3
23.2
6.7
5.4
28.5
25.7
4.4
3.6
Cipla
Sell
592
465
47,625
15,378
18,089
15.7
16.8
19.3
24.5
30.7
24.2
3.6
3.2
12.3
13.9
3.3
2.7
Dr Reddy's
Neutral
2,904
-
48,105
16,043
18,119
20.8
22.4
112.4
142.9
25.8
20.3
3.5
3.0
14.1
15.9
3.0
2.6
Dishman Pharma
Neutral
229
-
3,690
1,718
1,890
22.7
22.8
9.5
11.3
24.1
20.2
2.3
2.1
10.1
10.9
2.6
2.3
GSK Pharma*
Neutral
2,671
-
22,624
2,800
3,290
10.2
20.6
32.2
60.3
83.0
44.3
15.4
15.2
17.2
34.5
7.9
6.7
Indoco Remedies
Reduce
271
240
2,499
1,112
1,289
16.2
18.2
11.6
16.0
23.4
17.0
3.7
3.1
17.0
20.1
2.4
2.0
Ipca labs
Accumulate
549
613
6,923
3,303
3,799
15.3
15.3
17.3
19.7
31.7
27.9
2.8
2.5
9.1
9.4
2.2
1.9
Lupin
Buy
1,462
1,809
65,997
15,912
18,644
26.4
26.7
58.1
69.3
25.2
21.1
4.9
4.0
21.4
20.9
4.2
3.5
Sun Pharma
Buy
680
847
163,050
31,129
35,258
32.0
32.9
30.2
35.3
22.5
19.3
3.7
3.0
20.0
20.1
4.8
4.1
Power
Tata Power
Neutral
85
-
23,085
36,916
39,557
17.4
27.1
5.1
6.3
16.7
13.6
1.5
1.4
9.0
10.3
1.6
1.5
NTPC
Neutral
172
-
141,492
86,605
95,545
17.5
20.8
11.8
13.4
14.5
12.8
1.5
1.4
10.5
11.1
3.0
3.0
Power Grid
Accumulate
206
223
107,771
25,315
29,193
88.2
88.7
14.2
17.2
14.6
12.0
2.2
1.9
15.2
16.1
8.9
8.0
Real Estate
Prestige Estate
Buy
171
210
6,420
4,707
5,105
25.2
26.0
10.3
13.0
16.6
13.2
1.3
1.2
10.3
10.2
2.5
2.2
MLIFE
Buy
350
522
1,436
1,152
1,300
22.7
24.6
29.9
35.8
11.7
9.8
0.9
0.8
7.6
8.6
2.0
1.6
Telecom
Bharti Airtel
Neutral
376
-
150,162
105,086
114,808
34.5
34.7
12.2
16.4
30.8
22.9
2.1
1.9
6.8
8.4
2.3
2.0
Idea Cellular
Neutral
109
-
39,150
40,133
43,731
37.2
37.1
6.4
6.5
17.0
16.7
1.4
1.3
8.2
7.6
2.0
1.7
zOthers
Abbott India
Neutral
4,500
-
9,562
3,153
3,583
14.1
14.4
152.2
182.7
29.6
24.6
145.2
124.0
25.6
26.1
2.7
2.4
Asian Granito
Buy
273
351
820
1,060
1,169
12.2
12.5
12.7
15.9
21.5
17.2
2.0
1.8
9.5
10.7
1.1
0.9
Bajaj Electricals
Accumulate
259
295
2,618
4,801
5,351
5.7
6.2
10.4
13.7
24.8
18.9
3.1
2.7
12.4
14.5
0.5
0.5
Banco Products (India)
Neutral
195
-
1,395
1,353
1,471
12.3
12.4
14.5
16.3
13.5
12.0
18.6
16.7
14.5
14.6
1.0
104.0
Coffee Day Enterprises
Neutral
242
-
4,984
2,964
3,260
20.5
21.2
4.7
8.0
-
30.2
2.8
2.6
5.5
8.5
2.1
1.9
Ltd
Competent Automobiles Neutral
179
-
110
1,137
1,256
3.1
2.7
28.0
23.6
6.4
7.6
34.4
31.0
14.3
11.5
0.1
0.1
Elecon Engineering
Neutral
53
-
599
1,482
1,660
13.7
14.5
3.9
5.8
13.7
9.2
3.2
3.0
7.8
10.9
0.7
0.6
Finolex Cables
Neutral
441
-
6,746
2,883
3,115
12.0
12.1
14.2
18.6
31.1
23.7
16.5
14.4
15.8
14.6
2.0
1.8
Garware Wall Ropes
Accumulate
644
710
1,409
863
928
15.1
15.2
36.4
39.4
17.7
16.3
3.2
2.7
17.5
15.9
1.5
1.4
Goodyear India*
Neutral
712
-
1,642
1,598
1,704
10.4
10.2
49.4
52.6
14.4
13.5
66.5
58.4
18.2
17.0
0.7
98.9
Stock Watch
February 21, 2017
Company Name
Reco
CMP
Target
Mkt Cap
Sales ( Čcr )
OPM(%)
EPS (Č)
PER(x)
P/BV(x)
RoE(%)
EV/Sales(x)
(Č)
Price ( Č)
( Č cr )
FY17E
FY18E
FY17E
FY18E
FY17E
FY18E
FY17E
FY18E
FY17E
FY18E
FY17E
FY18E
FY17E
FY18E
zOthers
Hitachi
Neutral
1,353
-
3,678
2,081
2,433
8.8
8.9
33.4
39.9
40.5
33.9
32.7
27.2
22.1
21.4
1.8
1.5
HSIL
Neutral
294
-
2,128
2,384
2,515
15.8
16.3
15.3
19.4
19.2
15.2
19.1
16.5
7.8
9.3
1.1
1.0
Interglobe Aviation
Neutral
833
-
30,092
21,122
26,005
14.5
27.6
110.7
132.1
7.5
6.3
45.0
32.1
168.5
201.1
1.4
1.1
Jyothy Laboratories
Neutral
355
-
6,443
1,440
2,052
11.5
13.0
8.5
10.0
41.7
35.5
10.1
9.4
18.6
19.3
4.8
3.3
Kirloskar Engines India
Neutral
350
-
5,061
2,554
2,800
9.9
10.0
10.5
12.1
33.3
28.9
13.9
13.2
10.7
11.7
1.6
1.4
Ltd
Linc Pen & Plastics
Neutral
257
-
380
382
420
9.3
9.5
13.5
15.7
19.1
16.4
3.3
2.8
17.1
17.3
1.1
1.0
M M Forgings
Neutral
460
-
555
546
608
20.4
20.7
41.3
48.7
11.1
9.4
63.0
55.7
16.6
17.0
0.9
0.8
Manpasand Bever.
Neutral
696
-
3,981
836
1,087
19.6
19.4
16.9
23.8
41.2
29.2
4.9
4.3
12.0
14.8
4.5
3.4
Mirza International
Accumulate
94
107
1,126
1,024
1,148
18.0
18.0
6.9
8.0
13.6
11.6
2.3
1.9
16.6
16.3
1.3
1.2
MT Educare
Neutral
89
-
355
366
417
17.7
18.2
9.4
10.8
9.5
8.3
2.1
1.8
22.2
22.3
0.9
0.7
Narayana Hrudaya
Neutral
325
-
6,648
1,873
2,166
11.5
11.7
2.6
4.0
123.0
82.1
7.6
6.8
6.1
8.3
3.6
3.1
Navkar Corporation
Buy
165
265
2,349
369
561
42.9
42.3
7.2
11.5
22.8
14.3
1.7
1.5
7.4
10.5
7.4
4.8
Navneet Education
Neutral
141
-
3,284
1,062
1,147
24.0
24.0
6.1
6.6
23.1
21.2
4.7
4.2
20.6
19.8
3.2
2.9
Nilkamal
Neutral
1,715
-
2,560
1,995
2,165
10.7
10.4
69.8
80.6
24.6
21.3
98.0
85.2
16.6
16.5
1.3
1.1
Page Industries
Neutral
14,450
-
16,117
2,450
3,124
20.1
17.6
299.0
310.0
48.3
46.6
321.8
245.7
47.1
87.5
6.6
5.2
Parag Milk Foods
Neutral
223
-
1,880
1,919
2,231
9.3
9.6
9.5
12.9
23.7
17.3
3.7
3.0
15.5
17.5
1.1
1.0
Quick Heal
Neutral
253
-
1,775
408
495
27.3
27.0
7.7
8.8
32.7
28.8
3.0
3.0
9.3
10.6
3.5
2.9
Radico Khaitan
Accumulate
133
147
1,773
1,667
1,824
13.0
13.2
6.7
8.2
20.1
16.3
1.8
1.7
9.0
10.2
1.5
1.3
Relaxo Footwears
Neutral
423
-
5,082
2,085
2,469
9.2
8.2
7.6
8.0
56.0
53.2
21.7
18.5
17.9
18.8
2.5
2.2
S H Kelkar & Co.
Neutral
308
-
4,454
1,036
1,160
15.1
15.0
6.1
7.2
50.4
42.9
5.4
4.9
10.7
11.5
4.2
3.7
Siyaram Silk Mills
Neutral
1,703
-
1,596
1,652
1,857
11.6
11.7
92.4
110.1
18.4
15.5
2.7
2.4
14.7
15.2
1.2
1.0
Styrolution ABS India*
Neutral
605
-
1,064
1,440
1,537
9.2
9.0
40.6
42.6
14.9
14.2
38.0
34.6
12.3
11.6
0.7
0.6
Surya Roshni
Neutral
186
-
814
3,342
3,625
7.8
7.5
17.3
19.8
10.8
9.4
20.4
16.4
10.5
10.8
0.5
0.5
Team Lease Serv.
Neutral
875
-
1,496
3,229
4,001
1.5
1.8
22.8
32.8
38.4
26.6
4.1
3.6
10.7
13.4
0.4
0.3
The Byke Hospitality
Neutral
180
-
722
287
384
20.5
20.5
7.6
10.7
23.7
16.8
5.0
4.0
20.7
23.5
2.5
1.9
Transport Corporation of
Neutral
197
-
1,509
2,671
2,911
8.5
8.8
13.9
15.7
14.2
12.6
1.9
1.7
13.7
13.8
0.7
0.6
India
TVS Srichakra
Neutral
3,125
-
2,393
2,304
2,614
13.7
13.8
231.1
266.6
13.5
11.7
351.1
276.5
33.9
29.3
1.0
0.9
UFO Moviez
Neutral
414
-
1,142
619
685
33.2
33.4
30.0
34.9
13.8
11.9
1.9
1.7
13.8
13.9
1.6
1.2
Visaka Industries
Neutral
218
-
347
1,051
1,138
10.3
10.4
21.0
23.1
10.4
9.4
28.0
26.2
9.0
9.2
0.6
0.6
Stock Watch
February 21, 2017
Company Name
Reco
CMP
Target Mkt Cap
Sales ( Čcr )
OPM(%)
EPS (Č)
PER(x)
P/BV(x)
RoE(%)
EV/Sales(x)
(Č)
Price ( Č)
( Č cr )
FY17E FY18E FY17E FY18E FY17E FY18E FY17E FY18E FY17E FY18E FY17E FY18E FY17E FY18E
zOthers
VRL Logistics
Neutral
294
-
2,685
1,902
2,119
16.7
16.6
14.6
16.8
20.2
17.5
4.4
3.9
21.9
22.2
1.5
1.3
Wonderla Holidays
Neutral
373
-
2,107
287
355
38.0
40.0
11.3
14.2
33.0
26.3
4.7
4.1
21.4
23.9
7.0
5.7
Source: Company, Angel Research; Note: *December year end; #September year end; &October year end; Price as on February 20, 2017
Market Outlook
February 21, 2017
Research Team Tel: 022 - 39357800
DISCLAIMER
Angel Broking Private Limited (hereinafter referred to as “Angel”) is a registered Member of National Stock Exchange of India
Limited,Bombay Stock Exchange Limited and Metropolitan Stock Exchange Limited. It is also registered as a Depository Participant with
CDSL and Portfolio Manager with SEBI. It also has registration with AMFI as a Mutual Fund Distributor. Angel Broking Private Limited is a
registered entity with SEBI for Research Analyst in terms of SEBI (Research Analyst) Regulations, 2014 vide registration number
INH000000164. Angel or its associates has not been debarred/ suspended by SEBI or any other regulatory authority for accessing
/dealing in securities Market. Angel or its associates/analyst has not received any compensation / managed or
co-managed public offering of securities of the company covered by Analyst during the past twelve months.
This document is solely for the personal information of the recipient, and must not be singularly used as the basis of any investment
decision. Nothing in this document should be construed as investment or financial advice. Each recipient of this document should make
such investigations as they deem necessary to arrive at an independent evaluation of an investment in the securities of the companies
referred to in this document (including the merits and risks involved), and should consult their own advisors to determine the merits and
risks of such an investment.
Reports based on technical and derivative analysis center on studying charts of a stock's price movement, outstanding positions and
trading volume, as opposed to focusing on a company's fundamentals and, as such, may not match with a report on a company's
fundamentals. Investors are advised to refer the Fundamental and Technical Research Reports available on our website to evaluate the
contrary view, if any.
The information in this document has been printed on the basis of publicly available information, internal data and other reliable
sources believed to be true, but we do not represent that it is accurate or complete and it should not be relied on as such, as this
document is for general guidance only. Angel Broking Pvt. Limited or any of its affiliates/ group companies shall not be in any way
responsible for any loss or damage that may arise to any person from any inadvertent error in the information contained in this report.
Angel Broking Pvt. Limited has not independently verified all the information contained within this document. Accordingly, we cannot
testify, nor make any representation or warranty, express or implied, to the accuracy, contents or data contained within this document.
While Angel Broking Pvt. Limited endeavors to update on a reasonable basis the information discussed in this material, there may be
regulatory, compliance, or other reasons that prevent us from doing so.
This document is being supplied to you solely for your information, and its contents, information or data may not be reproduced,
redistributed or passed on, directly or indirectly.
Neither Angel Broking Pvt. Limited, nor its directors, employees or affiliates shall be liable for any loss or damage that may arise from
or in connection with the use of this information.